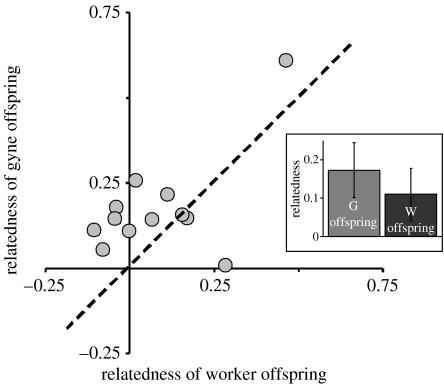
Figure 1.
Relatedness among worker offspring plotted against relatedness among gyne offspring. The dashed line indicates where the points would fall if relatedness within the two offspring groups were equal. In most cases, gyne relatedness exceeds worker relatedness. Inset: bar chart of mean relatedness of worker and gyne offspring (±s.e.).

