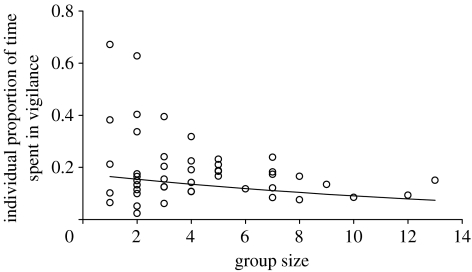
Figure 1.
Group-size effect on individual vigilance i.e. the proportion of time (Pind) that an individual spent in vigilance within a group (Y=exp(−1.548−0.076X)/[1+exp(−1.548−0.076X)]; F1,44=7.131; p=0.011). Each dot represents the mean value for the group but the linear regression was calculated between group size and the logit-transformed proportion of time using individual values and including a ‘group’ random effect in the linear mixed-effects model (see §2).

