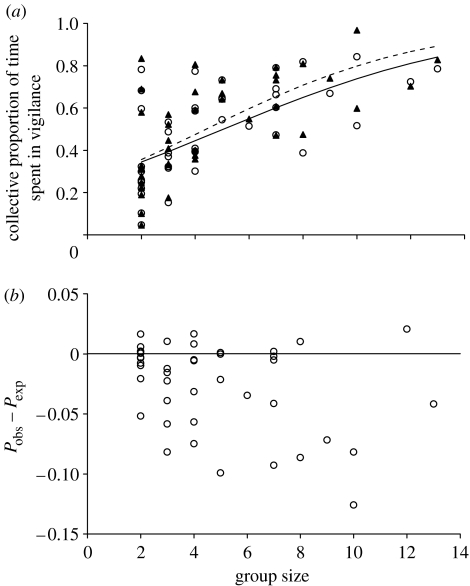
Figure 2.
(a) Group-size effect on the observed collective proportion and the expected proportion under the independent scanning assumption. Open circles indicate the observed proportions in each group (Pobs) i.e. the proportion of time that at least one individual spent in vigilance within a group and the solid-line, the observed linear regression on the logit-transformed Pobs: Y=1−[1/(1+exp(−1.06+0.210X))X]; F1,40=21.577; p<0.0001). Filled triangles indicate the expected values of proportion of time and the dotted-line, the expected linear regression under the independent scanning assumption (linear regression on the logit-transformed Pexp: Y=1−[1/(1+exp(−1.086+0.246X))X]; F1,40=24.697; p<0.0001). (b) Difference between the observed collective proportion (Pobs) and the expected collective proportion of time (Pexp) under an assumption of independent scanning, for each observed group.

