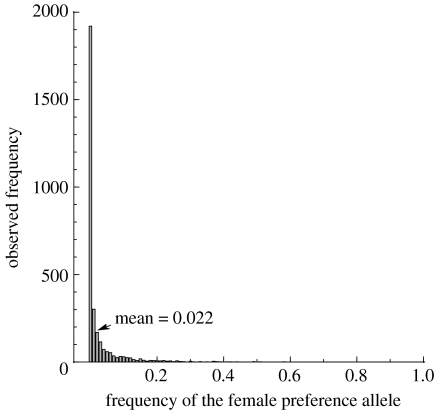
Figure 1.
Mutation–selection balance histogram of preference frequencies when k=1, μ=0.0002 and cost c=0.01, obtained sampling a simulated population every 500 generations for 1.5 million generations. The mean of the distribution is 0.022. Repeating this procedure for other cost values gives the mean values 0.50 (for c=0), 0.46 (c=0.0001) and 0.35 (for c=0.001).

