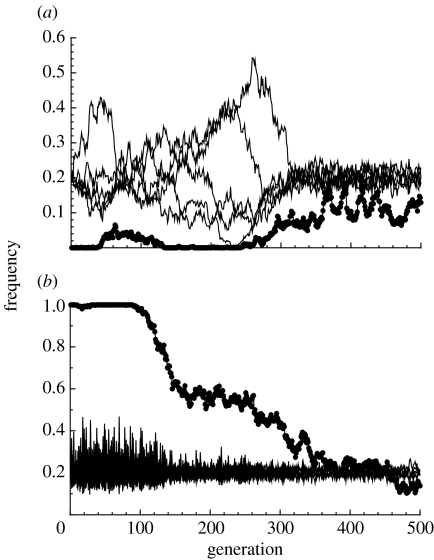
Figure 2.
Example trajectories of the frequencies of the female preference (dots) and male types (lines) when preferences are initially (a) absent or (b) fixed. The examples use strict preferences with no temporal variation in viability selection. Parameters used are N=1000, n=50, c=0.01, k=5, y=1 and μ=0.0002. The dynamics of male genotypes are characterized by drift when female preferences are absent and much tighter regulation when a fraction of females prefer rare males. Where preferences are fixed (i.e. up to generation 100 in (b)), the rarest male types are the most common in the next generation, leading to sharp fluctuations in male frequencies.

