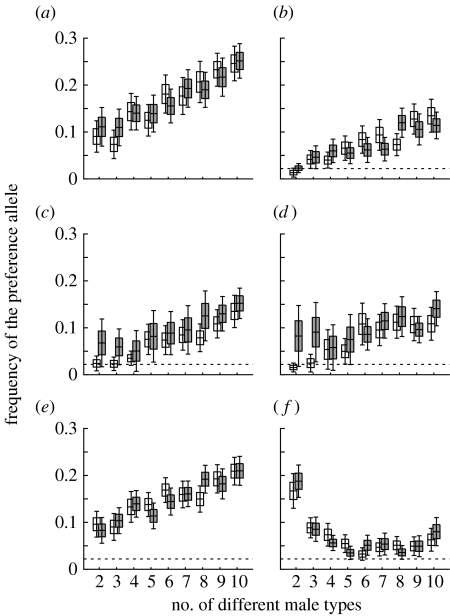
Figure 3.
Evolution of fully expressed (y=1) female preferences, with different numbers of male types k in the population. Data are presented as mean±s.e. (boxes) and ±95% CI for the mean (whiskers) for the frequency of the female preference allele after T generations. The expected frequency under mutation–selection balance is indicated by a dashed horizontal line (not visible in (a), where it is 0.5). It was numerically derived (figure 1). Populations started with either the preference allele absent (open boxes) or fixed (shaded boxes). (a) Strict preference for rarity with cost c=0 and no temporal variation in viability. (b) Strict preference for rarity with c=0.01 and no temporal variation in viability. (c) The same as for (b), but females have a threshold preference for rarity, mating with any male whose type frequency in her sample of n is below 5%. (d) The same as for (c), but the threshold frequency is 10%. (e) The same as for (b), but with frequency-independent viability selection using dI=0.5. (f) The same as for (b), but with frequency-dependent viability selection, dD=0.5. In all the examples, n=50, N=1000, μ=0.0002 and T=2500, except in (c) and (d) where T=5000 due to slower convergence between populations with different initial frequencies.

