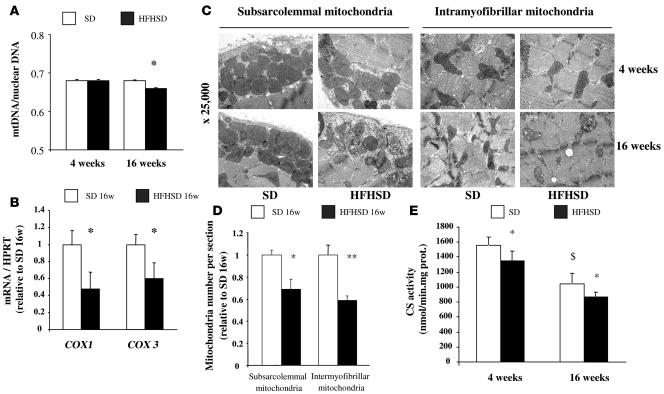
Figure 1. Decreased mitochondrial density in the skeletal muscle of mice fed the HFHSD for 16 weeks.
(A) mtDNA quantity calculated as the ratio of COX1 to cyclophilin A DNA levels determined by real-time PCR in the skeletal muscle of mice after 4 and 16 weeks of the SD and HFHSD (n = 6). Note that the scale of the y axis is between 0.5 and 0.8. (B) mRNA expression of mitochondria-encoded COX1 and COX3 genes determined by quantitative RT-PCR in the skeletal muscle of mice fed the HFHSD for 16 weeks (n = 6). Results were normalized by the mean value for the SD mice at 16 weeks set to 1 unit. (C) Mitochondrial density assessed by electron microscopy in the skeletal muscle of mice after 4 and 16 weeks of the SD or HFHSD. Original magnification, ×25,000. (D) Quantification of subsarcolemmal and intermyofibrillar mitochondria number per image area in the gastrocnemius muscle of mice after 16 weeks of the HFHSD (analysis of 5 images in 3 mice per group). Results were normalized by the mean value for the SD mice at 16 weeks set to 1 unit. (E) CS activity in mitochondria isolated from the gastrocnemius muscle after 4 and 16 weeks of the SD or HFHSD (n = 6). *P < 0.05, **P < 0.01 vs. SD; $P < 0.05 vs. SD at 4 weeks.

