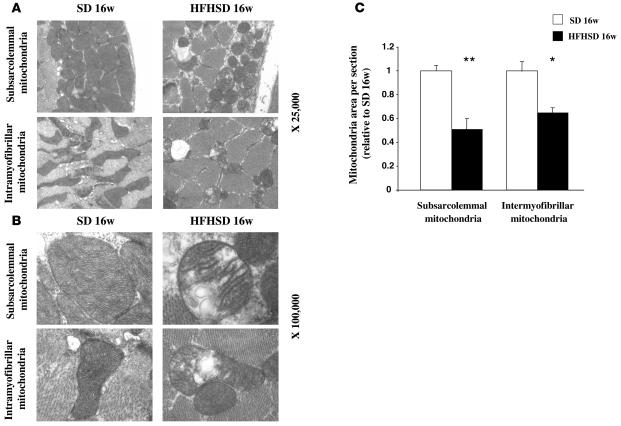
Figure 3. Alterations in the mitochondrial structure of skeletal muscle of mice fed the HFHSD for 16 weeks.
(A and B) Transmission electron microscopy images at original magnifications of ×25,000 (A) and ×100,000 (B) in subsarcolemmal and intermyofibrillar mitochondria from the gastrocnemius muscle of mice after 16 weeks of the SD or HFHSD. (C) Quantification of subsarcolemmal and intermyofibrillar mitochondria area in the gastrocnemius muscle of mice fed the HFHSD for 16 weeks (analysis of 5 images in 3 mice per group). Results were normalized by the mean value for the SD mice at 16 weeks set to 1 unit. *P < 0.05, **P < 0.01 vs. SD.

