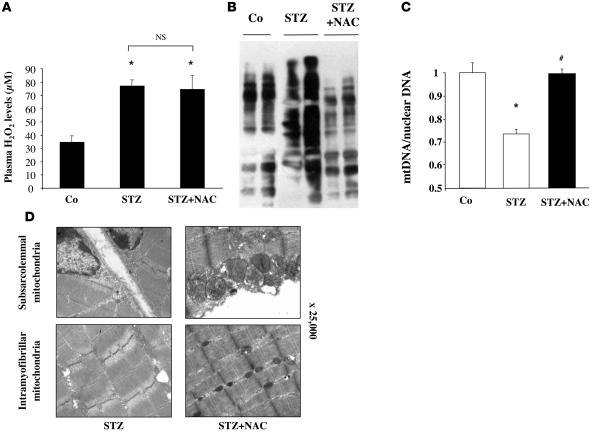
Figure 6. Antioxidant treatment restores mitochondrial alterations in STZ mice.
(A) Plasma H2O2 levels in Co and STZ mice treated or not with NAC (10 mM in drinking water). (B) Immunoblots showing total protein carbonylation in the gastrocnemius muscle of control, STZ, and NAC-treated STZ mice. (C) mtDNA copy number was calculated as the ratio of COX1 to cyclophilin A DNA levels, determined by real-time PCR, in the skeletal muscle of control, STZ, and NAC-treated STZ mice. Note that the y axis scale is between 0.5 and 1. Results were normalized by the mean value of the control condition set to 1 unit. *P < 0.01 vs. control; #P < 0.05 vs. STZ. (D) Transmission electron microscopy images (original magnification, ×25,000) of subsarcolemmal and intermyofibrillar mitochondria from the gastrocnemius muscle of STZ and NAC-treated STZ mice.

