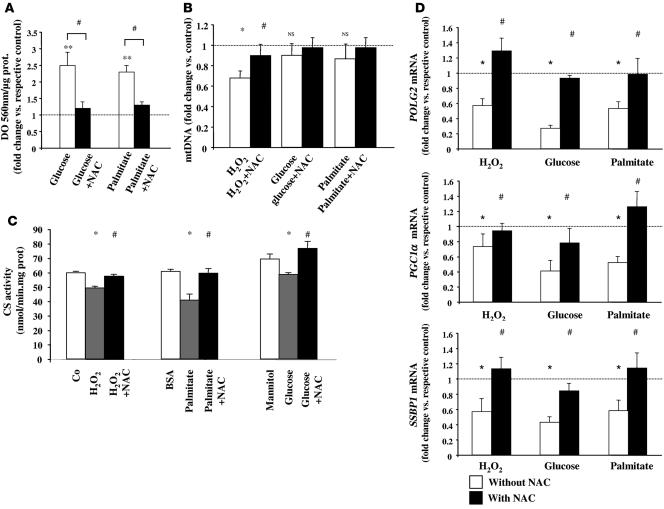
Figure 7. ROS-induced mitochondrial alterations in C2C12 muscle cells.
(A) ROS production, measured by NBT reduction, in differentiated C2C12 myotubes incubated with glucose (25 mM) or palmitate (200 μM) in the presence or absence of NAC (10 mM) for 96 hours (n = 4). Data are expressed relative to the respective control (dotted line). (B) Effect of H2O2 (0.1 mM), glucose (25 mM), and palmitate (200 μM) on mtDNA levels in differentiated C2C12 myotubes. Myotubes were treated for 96 hours in the presence or absence of 10 mM NAC (n = 4). Data are expressed relative to the control condition (dotted line). (C) CS activity measured in total lysates of myotubes treated for 96 hours with H2O2 (0.1 mM), glucose (25 mM), or palmitate (200 μM) in the presence or absence of NAC (10 mM) (n = 4). (D) mRNA levels of POLG2, SSBP1, and PGC1α genes determined by quantitative RT-PCR in H2O2-, glucose-, or palmitate-treated myotubes in the presence or absence of NAC for 96 hours (n = 4). All results are expressed as fold change relative to the values of untreated cells set to 1 unit (dotted line). *P < 0.05, **P < 0.01 vs. respective control; #P < 0.05 vs. without NAC.

