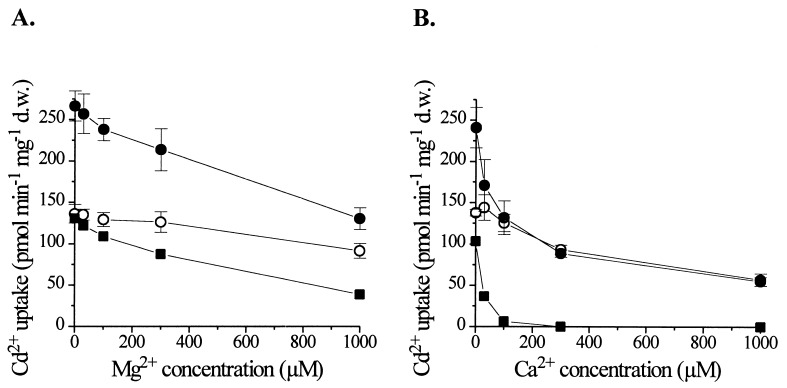
Figure 4.
Competition of Ca2+ and Mg2+ with LCT1-dependent Cd2+ uptake. Cd2+ uptake rates were determined for INVSc1 controls (○) and LCT1-expressing cells (•) in the presence of different Mg2+ (A) and Ca2+ (B) concentrations. LCT1-dependent Cd2+ uptake (■) was determined by subtracting the rates of control cells from the rates of LCT1-expressing cells. Bars = SE; n = 4.

