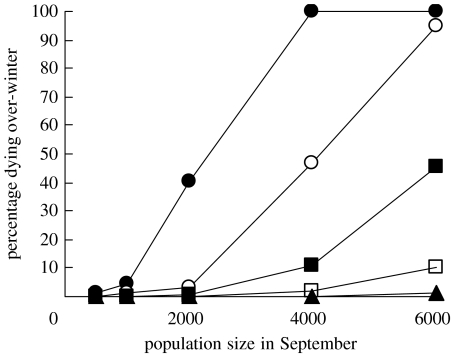
Figure 4.
Variation in the form of the density-dependent mortality function of oystercatchers given various population densities of Manila clams (0 clams m−2, filled circles; 5 clams m−2, open circles; 10 clams m−2, filled squares; 20 clams m−2, open squares; 40 clams m−2, filled triangles). Each data point depicts the mean predicted over-winter mortality arising from 10 replicate simulations of each scenario. The variation between replicate simulations was so small that the 95% CIs cannot be presented given the size of the symbols.

