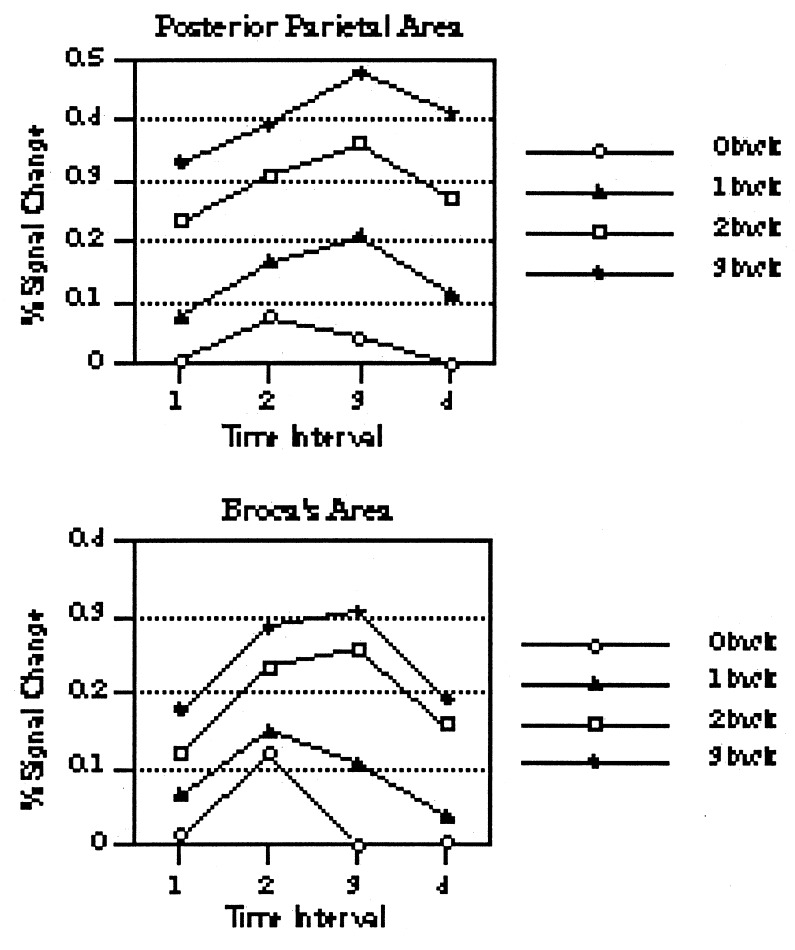
Figure 2.
Percentage of MRI signal change in activation as a function of temporal interval, with working memory load as the parameter. The results for the posterior parietal area are on the top, and the results for Broca’s area are on the bottom. Adapted from Cohen et al. (12)

