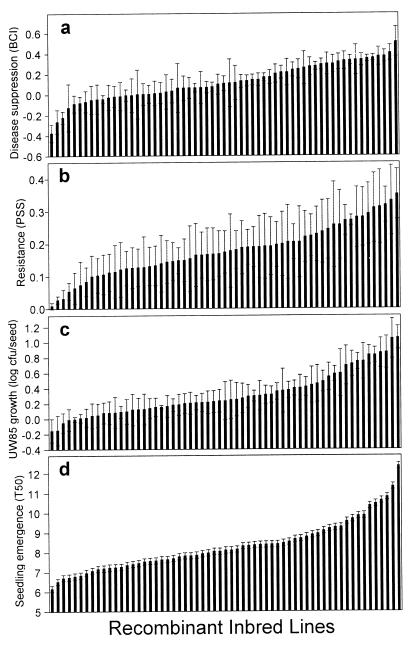
Figure 1.
Phenotypic variation among tomato 61 RIL for the traits: support of biocontrol (a), disease resistance (b), growth of UW85 on the seed (c), and rate of seedling emergence (T50) (d). The RIL are arranged in ascending order for each trait independently. Bars represent the SEM for a–c and the asymptotic SE of the parameter estimate T50 for d. The phenotypic variation among the RIL for all four traits is significant (P < 0.01).

