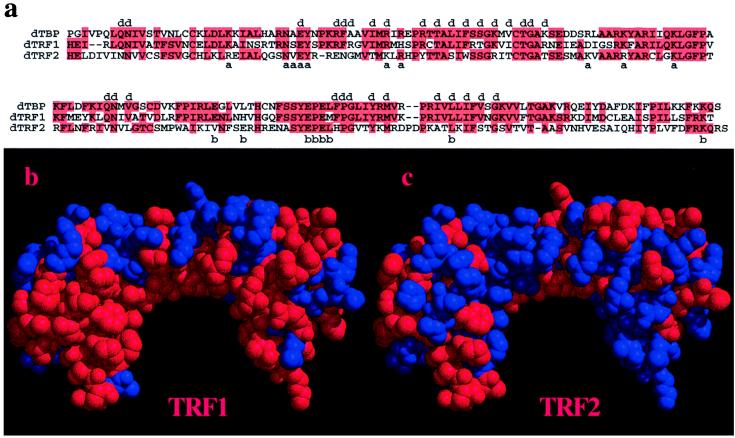
Figure 2.
Analysis of dTBP, dTRF1, and dTRF2 conserved residues. (a) Alignment of dTBP, dTRF1, and dTRF2. Red boxes highlight identical residues; a, b, and d indicate TFIIA-, TFIIB-, and DNA-binding residues, respectively (18, 23, 25, 26). (b and c) Location of residues conserved in dTRF1 (a) and dTRF2 (b) visualized on the TBP model. Red residues are conserved with TBP, and blue residues are nonconserved. The TBP model is as described in ref. 26, with the N-terminal repeat on the right.

