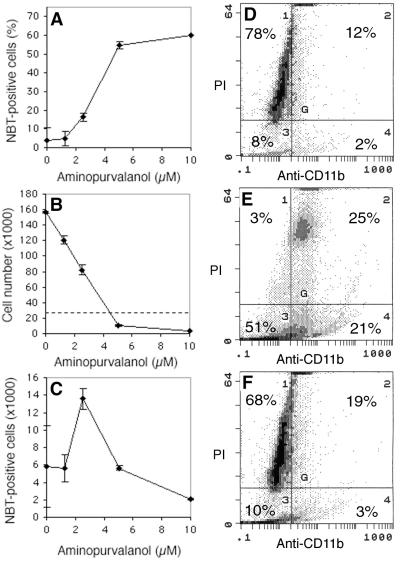
Figure 2.
Effect of AP on U937 cell differentiation. (A–C) Dose–response analysis. Cell counts were determined with the use of a hemocytometer. Each data point is the average of at least three experiments. (A) The fraction of NBT-positive cells increases with increasing concentrations of the drug. (B) The number of viable cells remaining after treatment with AP decreases with increasing concentrations of the drug. The dashed line indicates the starting number of cells. (C) The absolute number of cells expressing NBT-reducing activity after treatment with the drug is maximal between 2.5 and 5 μM AP. (D–F) Bivariate plots of cells stained for DNA content with PI and CD11b expression with an FITC-conjugated anti-CD11b monoclonal antibody and analyzed by flow cytometry. Numbers indicate the fraction of the total number of events in each quadrant. (D) Untreated cells display a range of DNA content typical of unsynchronized cells and few possess the CD11b antigen. (E) Cells treated with 5 μM AP show an accumulation of CD11b-positive cells with a 4N DNA (quadrant 2). Note the presence of cells with subdiploid DNA content (quadrants 3 and 4). (F) Cells treated with a closely related AP analogue look similar to the untreated population with little cellular fragmentation and few of the cells express CD11b antigen.

