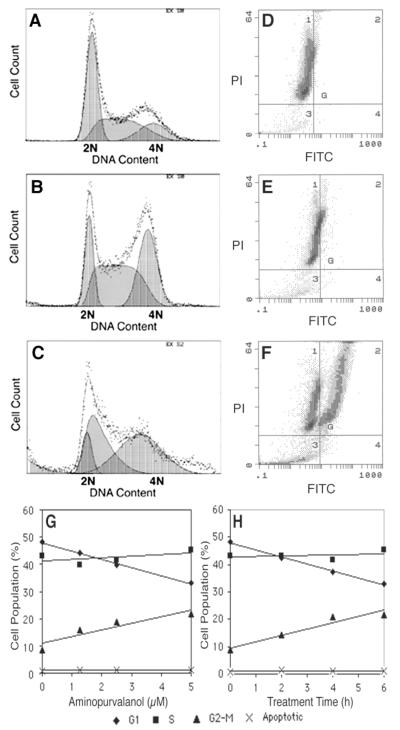
Figure 3.
Cell cycle changes induced by AP, as assayed by flow cytometry. For all the experiments, DNA content was determined for each cell based on the amount of PI labeling. DNA fragmentation was simultaneously detected by FITC-labeled nucleotide incorporation onto free DNA ends, using the TUNEL reaction. (A–C) Scattered data points represent actual number of cells with various contents of DNA. (A) Untreated, proliferating cell population. (B) Cell population treated with 5 μM AP for 8h. (C) Cell population treated with 40 μM AP for 8 h. The curves shaded gray represent an estimated number of cells with a 2N, 4N, and intermediate DNA content, as calculated with the multicycle program. (D–F) TUNEL assay results from an untreated cell population (D), a cell population treated with 5 μM AP for 8 h (E), and a population treated with 40 μM AP for 8 h (F). Note the presence of a prominent FITC-labeled cell population on the upper right quadrant and the increased population of fragmented cells in lower left quadrant. (G) Concentration-dependent changes in the G1-, S-, and G2/M-phase cells in cell populations treated with AP for 6 h, as determined from the distribution of DNA per cell in the cell population. (H) Time-dependent changes in G1-, S-, and G2/M-phase populations treated with 5 μM AP.

