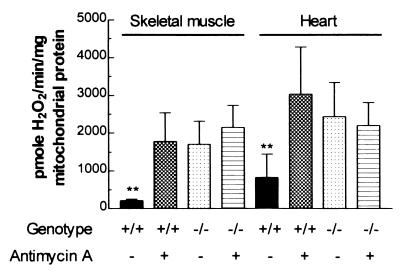
Figure 1.
Mitochondrial H2O2 production is maximized in Ant1tm2Mgr (−/−) skeletal muscle and heart. The bars represent the mean ± SD level of H2O2 production for mitochondria from normal (+/+) and Ant1tm2Mgr (−/−) animals with and without antimycin A. ∗∗, P < 0.01 for normal (+/+) as compared with (−/−) mitochondria for the same tissue; n = 5 for each group.

