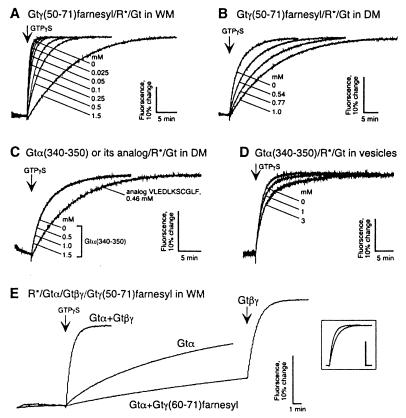
Figure 3.
Rate of rhodopsin (MII)-catalyzed Gt activation determined from changes of intrinsic Gtα fluorescence. Active rhodopsin-catalyzed formation of a Gt–GTPγS complex triggered by GTPγS addition results in an intrinsic fluorescence change of Gt. Inhibition of rhodopsin-catalyzed Gt activation by Gtγ(50–71)farnesyl in WM (A) and DM (B). Lack of effect of Gtα(340–350) on Gt activation in DM (C); similar results were obtained in WM with Gtα(340–350) up to 2 mM (data not shown). Competition of the native Gtα(340–350) peptide demonstrated for phosphatidylcholine vesicles reconstituted with low amounts of rhodopsin (rhodopsin content is approximately 15–20 times lower than in WM) (D). Gtγ(50–71)farnesyl does not replace Gtβγ in rhodopsin catalyzed activation of Gt (E). Activation traces from three independent experiments are superimposed: 1, control activation of Gt reconstituted from purified Gtα (450 nM) and Gtβγ (1 μM) subunits; 2, activation of the Gtα alone; 3, activation of Gtα in the presence of 200 μM of Gtγ(50–71)farnesyl, followed by the rescue addition of the Gtβγ. (Inset) Superimposed activation traces from experiment 1 (Gtα+Gtβγ) and experiment 3 after final addition of Gtβγ (Gtα+Gtγ(50–71)farnesyl+Gtβγ). The traces are corrected for the gross fluorescence change because of the addition of Gtβγ. Note that under the conditions of these experiment (see Materials and Methods) most of the G-protein is present in soluble form (26).

