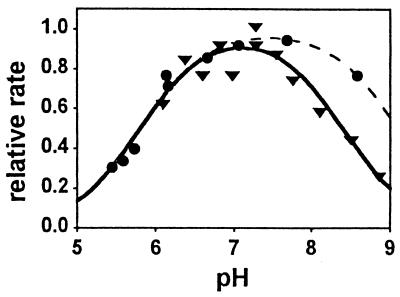
Figure 5.
pH-rate profile for rhodopsin-catalyzed Gt activation. pH dependence of the rate of the fast phase of the dissociation signal yields a “bell-shaped” pH-rate profile (different symbols identify two independent experiments). The data were fit to a product of two Henderson–Hasselbalch-type titration curves, yielding pKa1 = 5.8 (both curves), pKa2 = 8.4 (solid line) and 9.1 (dashed line; independent measurement with a second sample), respectively. For better comparison, data are normalized to the maximum rate obtained by the respective fit.

