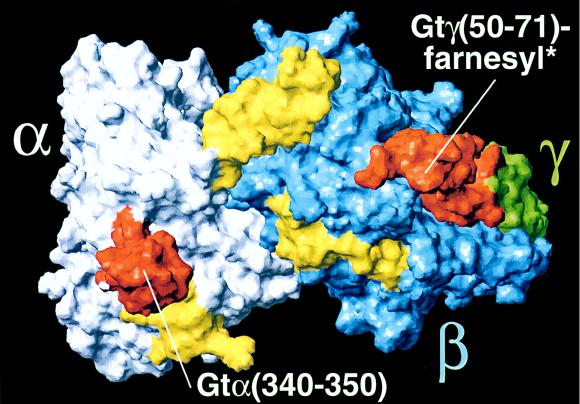
Figure 6.
Putative rhodopsin interacting surface of Gt. Gtα(340–350) and Gtγ(50–71)farnesyl are shown in orange at the opposite sides of the Gt surface. Other domains interacting with active rhodopsin are in yellow (9); also see Methods. Gtα(340–350) is shown in its conformation bound to the active receptor as obtained from NMR studies (18). *Only part of the Gtγ(50–71)farnesyl sequence is shown, namely Gtγ(50–66), as resolved by x-ray crystallography (28).

