Figure 3.
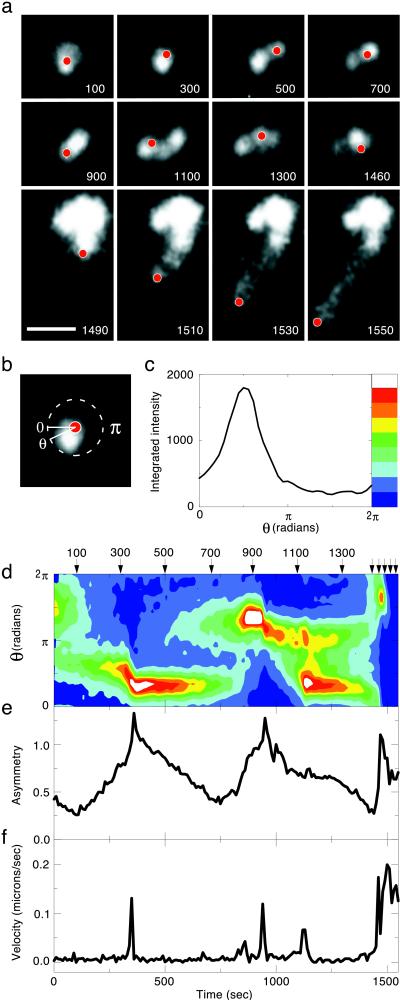
Asymmetry builds up in the actin cloud before bead takeoff. (a) Video sequence of a 0.5-μm-diameter ActA-His-coated bead during the transition from cloud to tail. Rhodamine-actin fluorescence is depicted in gray-scale. The position of the polystyrene bead, as determined from paired phase-contrast images, is indicated by the red dots. Actin filament density in the cloud becomes strikingly asymmetric, and the particle bounces around within the confines of the cloud, before escaping and moving rapidly away ≈1,480 sec into the video sequence. Total time elapsed in seconds is shown at the bottom right corner of each frame. Note time compression for the four frames in the bottom row. The contrast in these last four frames has been digitally enhanced relative to the first eight, so that the dimmer comet tail can be seen as well as the bright cloud. (Bar = 5 μm.) (b) Angular variation of actin density within the cloud for one frame from the video sequence shown in a (at 300 sec). Fluorescence intensity within a circle of 1-μm radius centered on the bead varies as a function of radial angle θ. (c) Actin filament density distribution as a function of angle for the video frame shown in b. For each value of the angle θ, the fluorescence intensity is integrated over a wedge-shaped segment between θ − π/36 and θ + π/36 within a radius of 1 μm around the bead. Color bar shows translation of integrated fluorescence intensity into a color scale, used in d. (d) Actin filament density distribution around this bead as a function of time. The arrows indicate the frames shown in a. Integrated fluorescence intensity as a function of angle was determined as in c for each frame in the video sequence and was depicted by using a color scale. This contour plot shows fluorescence intensity in the cloud as a function of both time and angle. Note that there are two distinct peaks of actin density at 1,125 sec. Note also that each of the three peaks in the contour plot correlates with a velocity spike in f. This plot does not show the obvious asymmetry after the bead starts moving because the fluorescence intensity of the tail is far below that of the actin cloud. (e) Cloud asymmetry for this bead as a function of time. An asymmetric distribution of actin filaments gradually builds in the cloud before each burst of speed. “Asymmetry” here is a scalar describing the degree to which actin filament density is concentrated in a particular sector of a circle centered on the bead. Asymmetry is calculated by computing the SD of the fluorescence intensity as a function of θ and normalizing to the mean values at each time point. A perfectly spherical cloud (SD = 0) would have an asymmetry of 0, but, due to the finite noise in fluorescence intensity, the measured asymmetry is larger. (f) Velocity of this bead as a function of time. Superimposed on apparently random thermal motion of the particle are several sharp velocity peaks that correspond to peaks in actin filament density apparent in d before the rapid escape of the particle near the end of the sequence.

