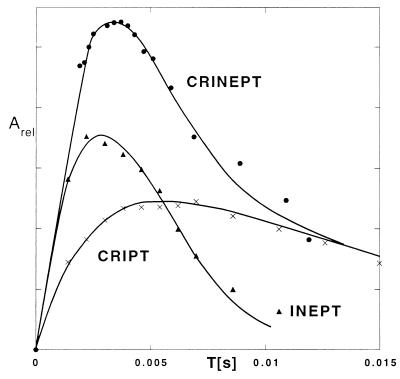
Figure 4.
Buildup curves of magnetization transfer for CRIPT, INEPT, and CRINEPT for the well resolved 15N—1H cross peak of [u-15N, 75%2H]-labeled S. aureus aldolase (32) at [ω1(15N) = 121.0 ppm, ω2(1H) = 11.1 ppm] measured at 750 MHz (protein concentration 0.4 mM, solvent 95% H2O/5%2H2O, T = 4°C). The buildup curves were obtained from serial measurements with variable T values by using the pulse sequences of Fig. 2. For CRINEPT, two free induction decays with phases x and −y for the second 1H radio-frequency pulse, respectively, were measured for each value of T (Fig. 2c), which doubled the measuring time when compared with a or b. The two subspectra thus obtained are cosine- or sine-modulated with regard to the proton chemical shift during the time period T and were used to calculate the absolute value intensity of the individual cross peaks, which represents the total CRINEPT-transferred polarization (Eq. 7). CRIPT, INEPT, and CRINEPT buildup curves were fitted by using Eqs. 1, 4, and 7, respectively, which resulted in RI = 236 ± 10 s−1 and RC = 172 ± 13 s−1 for CRIPT, RI = 254 ± 18 s−1 for INEPT, and RI = 238 ± 13 s−1 and RC = 153 ± 13 s−1 for CRINEPT.

