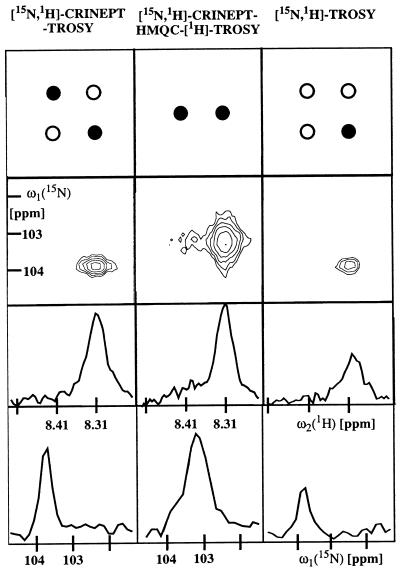
Figure 5.
Comparison of signal intensity and lines shape for [15N,2H]-CRINEPT-TROSY (Fig. 3a), [15N,1H]-CRINEPT-HMQC-[1H]-TROSY (Fig. 3b), and [15N,1H]-TROSY (33). The data were recorded with [u-15N, 75% 2H]-labeled S. aureus aldolase (32) in 95% H2O/5% 2H2O, T = 4°C at 750-MHz 1H frequency. The backbone amide moiety of Gly 43 is shown. Before Fourier transformation, the three data sets were multiplied with a cosine window function in all dimensions and were transformed to a size of 256 × 2,048 complex points by using the program prosa (34). The total measuring time was 4 h per experiment, with t1 max = 50 ms, t2 max = 98 ms, T = 5.4 ms, and an interscan delay of 0.7 s. The panels at the top indicate the peak selections by the three experiments. As indicated by the black circles, only the most slowly relaxing component of the four-component signal is detected in TROSY (7), [15N,1H]-CRINEPT-TROSY selects the slowest and fastest relaxing components, and [15N,1H]-CRINEPT-HMQC-[1H]-TROSY yields a doublet in the proton dimension. The contour plots contain the signal of the backbone 15N—1H group of Gly-43. The two rows of panels in the lower half of the figure show cross sections along ω2(1H) and along ω1(15N), respectively, through the peaks shown in the contour plots.

