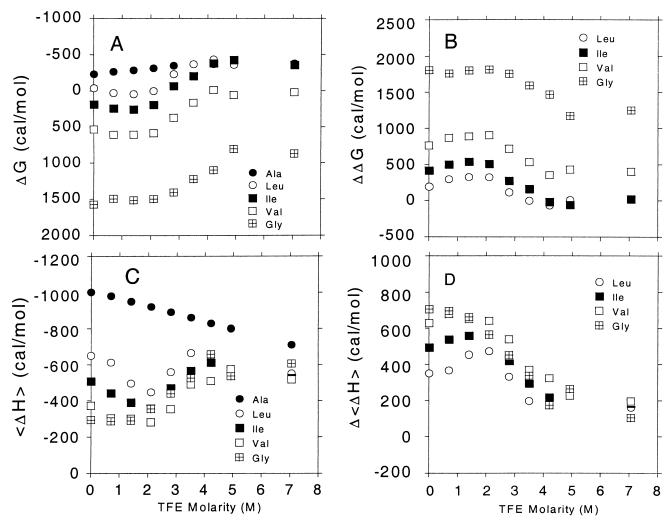
Figure 2.
Free energy changes corresponding to helix propensity values at 0°C and enthalpy changes for formation of the entire peptide helix but expressed per residue as a function of TFE molarity measured from 0 to 50 volume% TFE. (A) Free energy change of ΔG = −RTln [wX/(1+v)] (see text) as a function of TFE molarity, where wX is the helix propensity of residue X = Ala, Leu, Ile, Val, and Gly. (B) The helix propensity ratio relative to alanine (expressed as ΔΔGX = ΔGX − ΔGA) versus [TFE]. (C) The average enthalpy change per residue, <ΔH>, for formation of the entire helix versus [TFE], and Δ<ΔHX> = <ΔHX> − <ΔHA> is shown in D for comparison.

