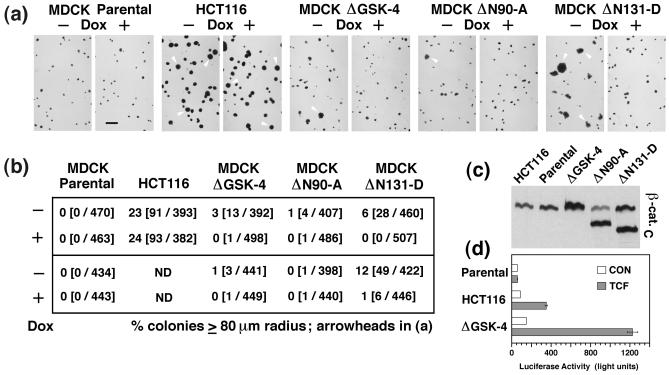
Figure 4.
MDCK cells expressing ΔN131 β-catenin exhibit increased growth in soft agar compared with cells expressing ΔN90 or ΔGSK β-catenin. (a) Photomicrographs of colonies 15 days after plating in soft agar. Parental MDCK cells, the human colon cancer cell line HCT116, and MDCK clones ΔGSK-4, ΔN90-A, and ΔN131-D were preincubated for 2 days −/+Dox and cultured 15 days −/+Dox in soft agar. Colonies were stained overnight with p-iodonitrotetrazolium violet. Representative images of two independent experiments are shown, and some of the colonies with a radius of ≥80 μm in these images are marked with arrowheads. (Bar = 500 μm.) (b) Percentage of colonies that had a radius of ≥80 μm in the culture; numbers in parentheses are the numbers of colonies with ≥80-μm radius per total numbers of measured colonies. Results from two independent experiments are shown. (c) HCT116 cells, MDCK parental cells, and MDCK clones were extracted with 1% SDS, and 10-μg protein lysates were subjected to SDS/PAGE and immunoblotted with mAb β-cat.C. (d) In parallel with SDS extraction shown in c, part of the cultures of MDCK parental cells, HCT116 cells, or MDCK clone ΔGSK-4 were transfected with control vector pFOPtkFLASH (CON, open bars) or pTOPtkFLASH (TCF, shaded bars). Bars represent values from one sample (CON) or mean values from two independent samples (TCF).

