
Figure 8. RNAi-mediated suppression of KSHV vGPCR in mECK36 blocks angiogenicity and tumorigenesis.
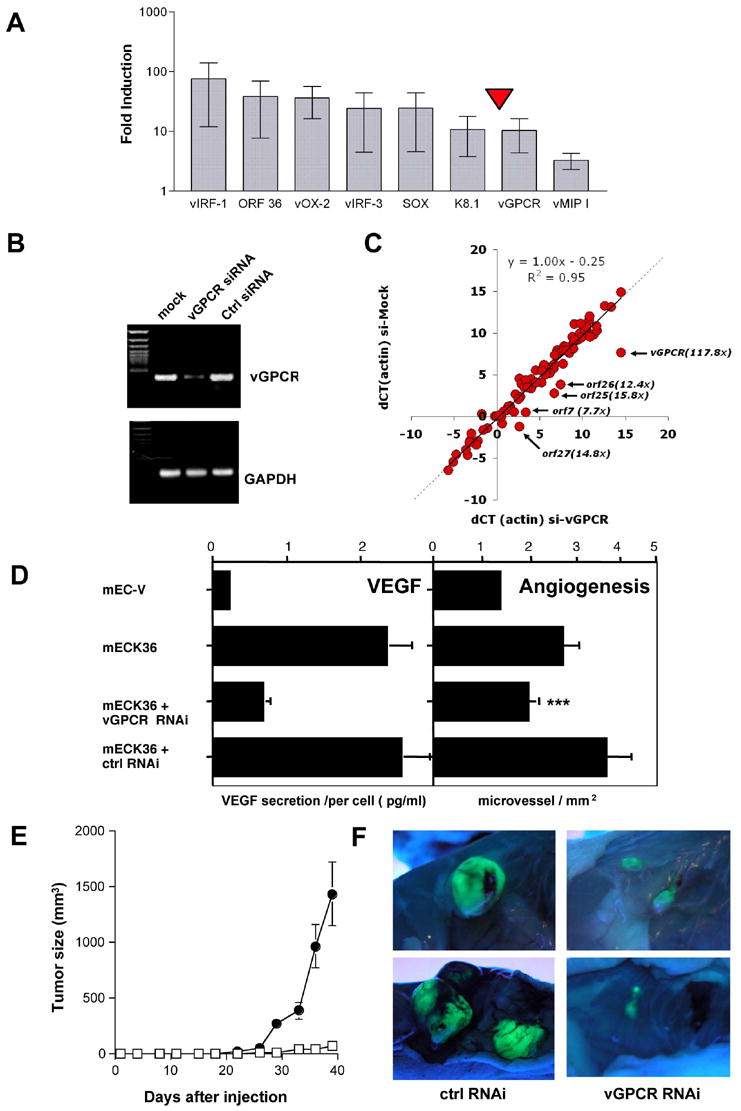
(A) mRNA levels of KSHV genes in mECK36 tumors compared to cultured mECK36 determined by Real time qRT-PCR. Mean values (+/− SD) from 3 tumor samples were plotted. (B) RT-PCR analysis of vGPCR and GAPDH for mECK36 cells transfected with control shRNA and vGPCR shRNA vector (C) Log2 scale plot (dCT) of the actin-normalized KSHV mRNA levels of mECK36 transfected with control shRNA (horizontal) or vGPCR shRNA (vertical). The arrows indicate transcripts that are specifically downregulated and the annotation shows the identity and fold downregulation. (D) Left panel: Levels of VEGF secretion for mECK36 transfected with either control shRNA or vGPCR shRNA vector measured by ELISA. Bars indicate mean of duplicate measures +/− range. Right panel: Angiogenesis in skin for mEC-V, mECK36, mECK36 cells transfected with either control shRNA or vGPCR shRNA vector. The bar graphs show the mean microvessel density (vessels/mm2) +/− SEM. Total N (both flanks) = 10. (***) indicates significant differences between vGPCR RNAi and control RNAi groups (P<0.05) (N=10). (E) Tumor formation of mECK36 cells transfected with control shRNA (closed circles) or with vGPCR shRNA vector (open squares). Data indicate mean tumor size +/− SEM (N=10). (F) Tumor appearance after dissection and lighting using a long-wave UV lamp for mECK36 cells transfected with control shRNA or with vGPCR shRNA vector.