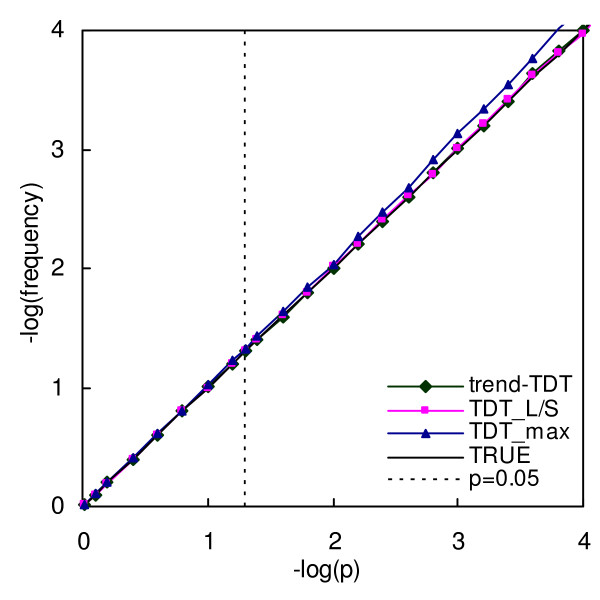
Figure 1.
Type I error rates for trend-TDT, TDTmax and TDTL/S. X axes is the expected p value in minus logarithm scale, Y axes is the observed frequencies that the calculated p value is equal to or less than the expected p value, in minus logarithm scale. The line "TRUE" is the expected curve for a correct test, which should be exactly the line "y = x".

