Figure 2.

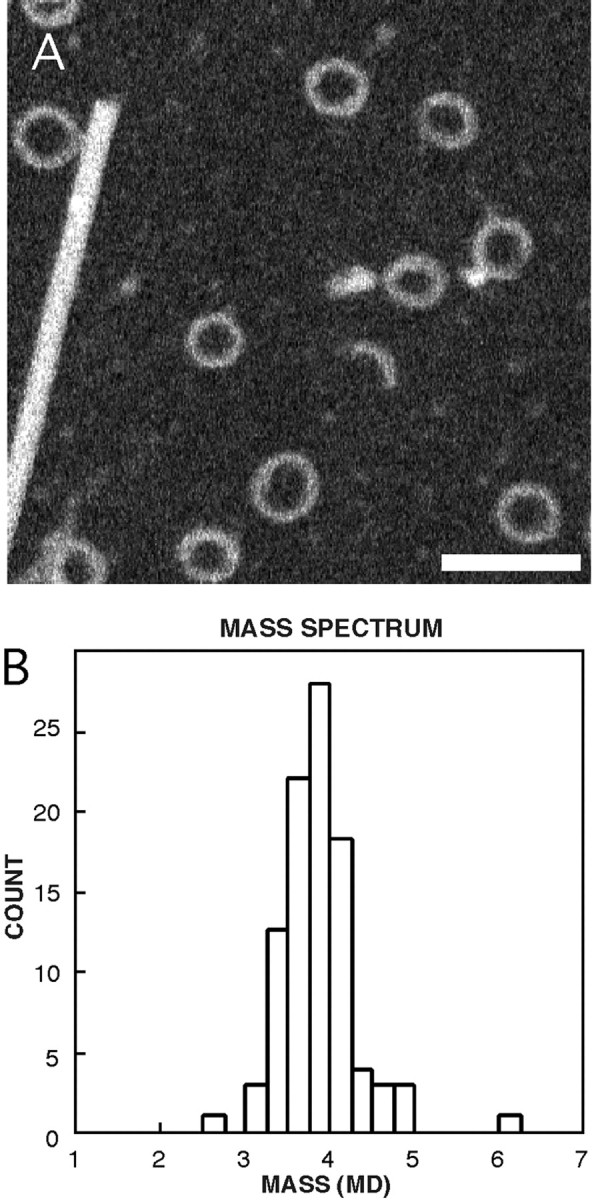
Mass distribution of RTTs determined by STEM. Shown are a field of RTTs and a TMV particle (A), and the mass histogram (B). Bar, 100 nm.

Mass distribution of RTTs determined by STEM. Shown are a field of RTTs and a TMV particle (A), and the mass histogram (B). Bar, 100 nm.