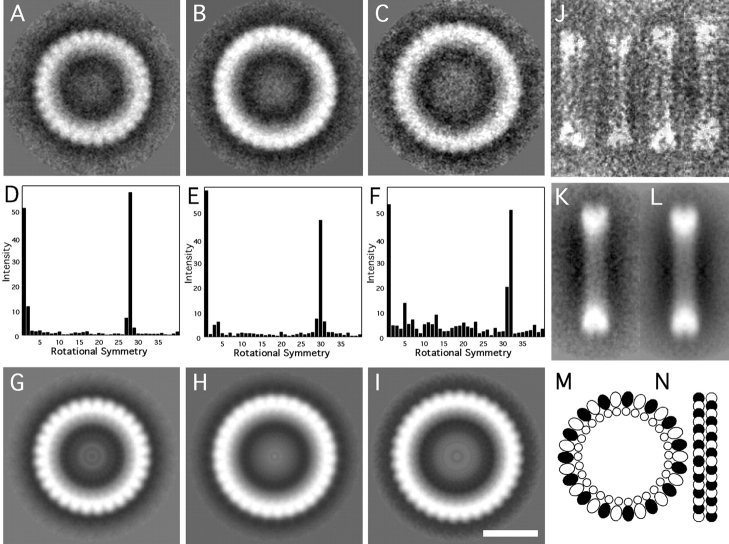
Figure 4.
Image analysis and a molecular model of RTTs. Shown are the cross-correlation averages of 28-, 30-, and 32-fold symmetric particles viewed axially (A–C), the corresponding power spectra (D–F), and the final symmetrized images (G–I). Also shown are selected side-views of rings (J), the correlation average (K), and a symmetrized image (L). A molecular model of the 30-fold RTT is shown in M and N. In the model, Rev monomers are located on the inside and tubulin monomers on the outside (M). The side-view (N) shows RTTs as composed of bi-layered rings. The α- and β-tubulin monomers are differentiated as black and white. Bar, 20 nm.

