
Figure 2. Maintenance of growth prevents induction of autophagy and inhibits salivary gland degradation.
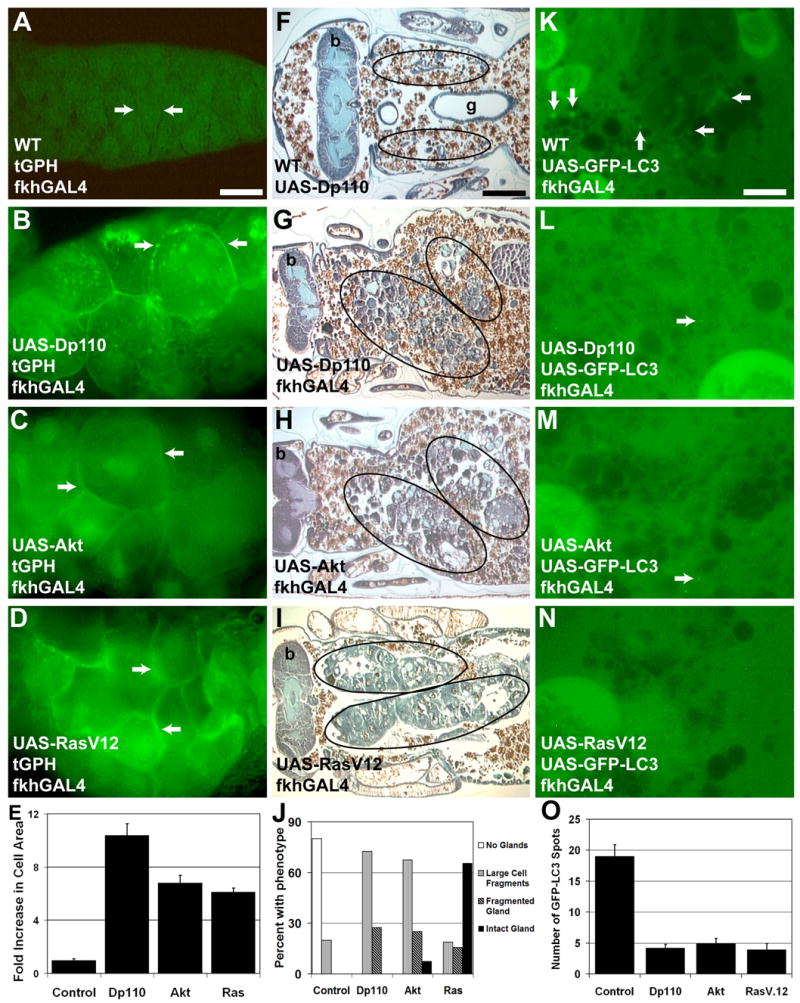
(A–D) Cortical localization of tGPH correlates with growth. (A) At 13.5 hours apf, no cortical tGPH is observed in control dying salivary glands. Expression of either (B) Dp110, (C) Akt or (D) RasV12 in the salivary glands results in increased growth and maintenance of cortically localized tGPH 13.5 hours apf. (E) Cell area measurements in the indicated genotypes 13.5 hours apf illustrate the increase in cell size in Dp110, Akt, and RasV12 expressing salivary glands. The data are presented as fold increase in cell area compared to cells from control fkhGAL4; Canton-S pupae and are represented as mean ± SE. (F–I) Paraffin sections of pupae 24 hours apf. (F) Salivary glands are completely degraded in control pupae (Canton-S/UAS-Dp110) 24 hours apf. The location where glands resided prior to degradation is encircled. Maintaining growth by expression of either (G) Dp110 (H), Akt, or (I) RasV12 in salivary glands inhibits degradation and tissue is present 24 hours apf. Circles outline the persistent salivary gland tissue in these pupae. (J) Paraffin sections of the above genotypes were evaluated for the amount and type of salivary gland tissue that was present in 24 hour pupae. The percentage of pupae with each phenotype is presented (n > 20 pupae/genotype). (K–N) GFP-LC3 spots are abundant in control salivary glands 13.5 hours apf (K), but are reduced in 13.5 hour salivary glands expressing (L) Dp110, (M) Akt, and (N) RasV12. (O) The number of GFP-LC3 spots per image was quantified for the indicated genotypes 13.5 hours apf. The data is represented as mean ± SE. Scale bar in (A) is 60 μm and (A–D) are the same magnification. Scale bar in (F) is 200 μm and (F–I) are the same magnification. Scale bar in (K) is 19 μm and (K–N) are the same magnification. Arrows point to the cell cortex in (A–D). Arrows point to GFP-LC3 spots in (K–N). Symbols are (b) brain and (g) gut.