
Figure 7. Expression of Atg1 induces caspase-independent degradation of salivary glands.
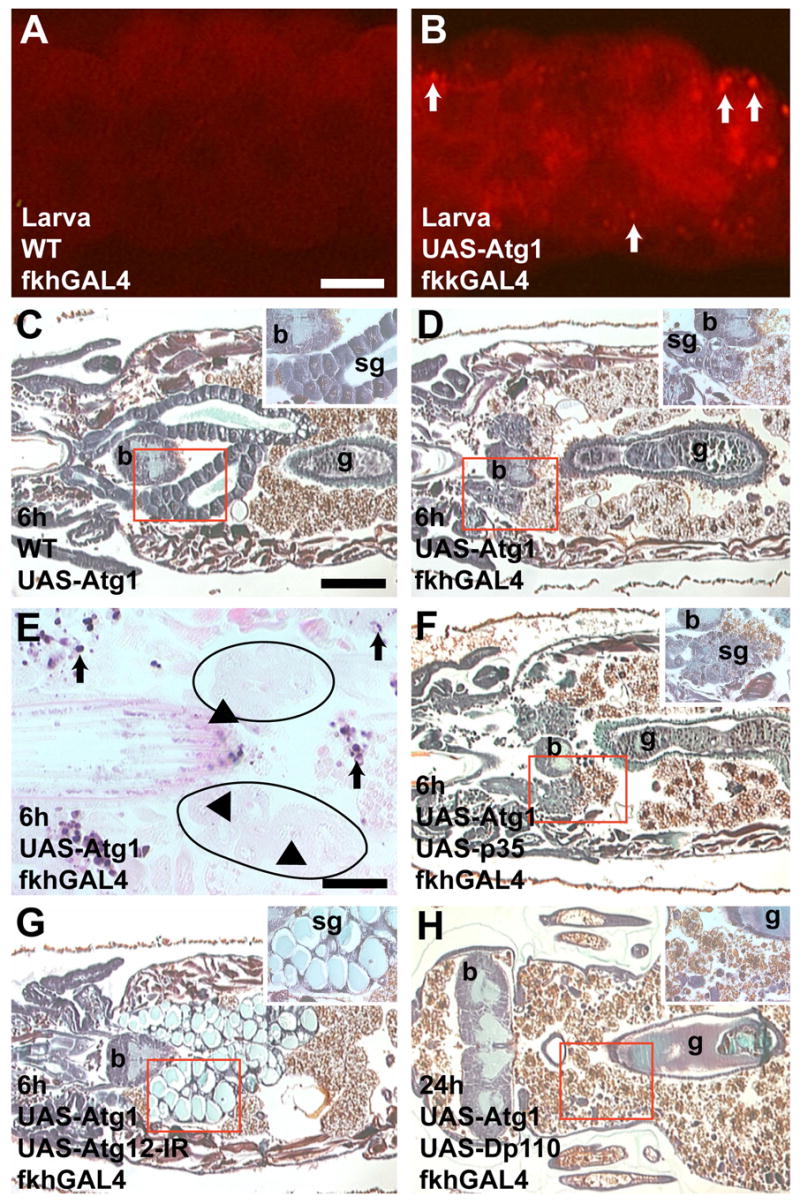
(A–B) Lysotracker staining detects autophagy. (A) Little to no lysotracker staining is observed in Canton-S; fkhGAL4 control salivary glands from feeding larvae. (B) Many lysotracker positive spots are detected in feeding larval salivary glands expressing Atg1GS10797 (white arrows). (C) Paraffin sections 6 hours apf show that intact glands are present in UAS-Atg1/Canton-S control pupae. (D) Atg1GS10797 expression causes premature degradation of salivary glands. (E) No TUNEL-positive nuclei are present 6 hours apf in Atg1GS10797-expressing salivary glands. Black arrowheads point to TUNEL-negative nuclei within the salivary glands. Black arrows indicate TUNEL-positive cells in adjacent tissues. (F) Inhibition of caspases by co-expression of p35 does not suppress the Atg1GS10797 cell degradation phenotype. (G) Inhibition of autophagy by co-expression of atg12-IR suppresses the Atg1GS10797 cell degradation phenotype. (H) Co-expression of Atg1GS10797 with Dp110 leads to complete salivary gland degradation. Scale bar in (A) is 75 μm and (A–B) are the same magnification. Scale bar in (C) is 200 μm and (C–D and F–H) are the same magnification. Scale bar in (E) is 50 μm. Red boxes indicate the region of higher magnification shown in the insets for each image. Symbols are (b) brain, (sg) salivary gland, and (g) gut.