
Figure 5. Determination of TNF-α mRNA levels by Real-time RT-PCR.
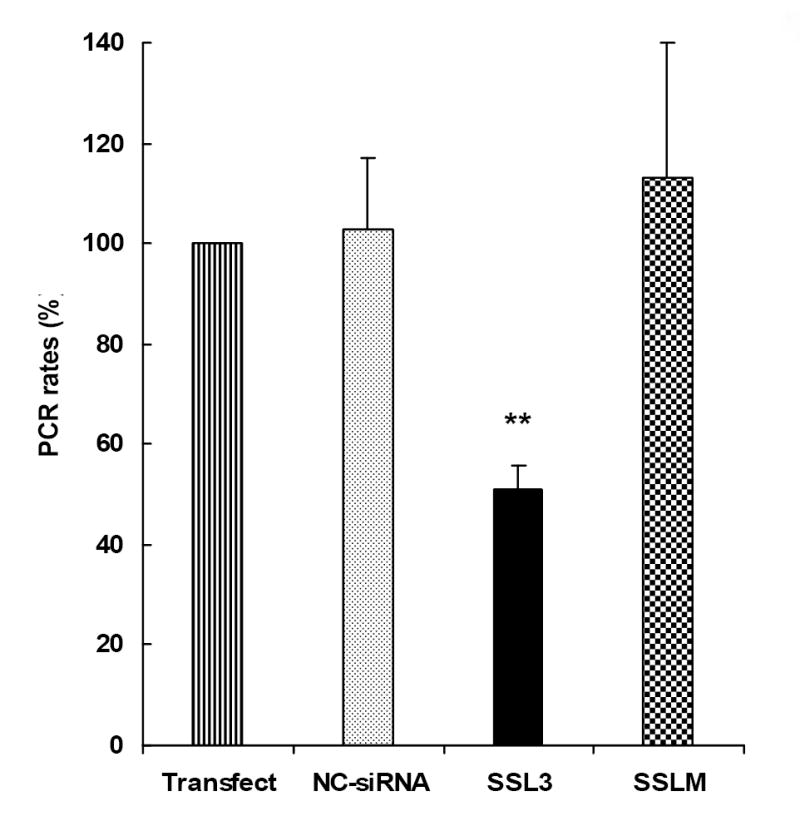
Freshly isolated Kupffer cells were cultured for 6 days followed by transfection with 25 nM siRNAs, NC-siRNA and SSL3. Cells treated with transfection reagent and NC-siRNA were included as controls. Twenty four hours after the transfection, cells were exposed to LPS for 1 h and the total RNA was extracted and reverstranscribed to cDNAs. 10 ng (cDNA) aliquots of each sample was taken for the determination of quantitative real-time PCR as detailed in Methods. The PCR rates of TNF-α mRNA synthesis in various treatment groups were normalized to the rate of synthesis of β-actin, included as the endogenous control. Data were plotted as percent PCR value of 100 to samples treated with the transfection reagent alone. Bars indicate PCR values which are the means + S.E. of n=3 determinations. **p < 0.01 between SSL3 and Transfect control.