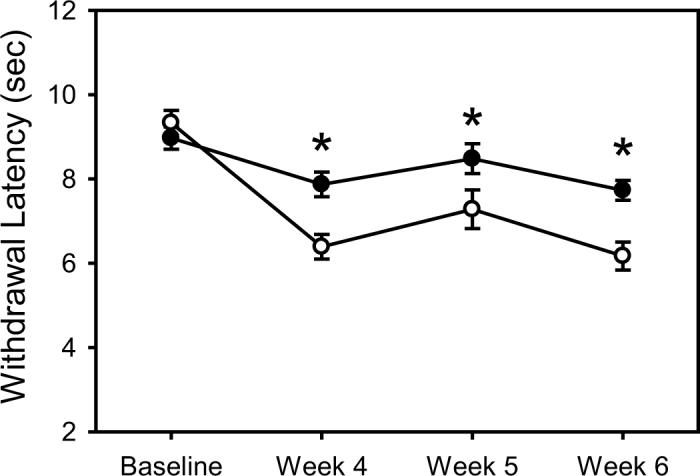
Figure 2.

Graph showing changes in behavioral response to thermal stimuli applied to the plantar surface of the left hind foot in STZ-D (open circles) and control (black circles) rats. Differences in behavioral responsiveness to noxious heat between control and STZ injected rats developed by four weeks after induction of diabetes. All values are expressed as the group means at four time points: baseline, and 4, 5 and 6 weeks after confirmed diabetes. Asterisks indicate a significant difference between groups, determined using a repeated measures mixed model ANOVA (SPSS for Windows) with Dunnetts T3 for post-hoc analysis (* = p < .05).
