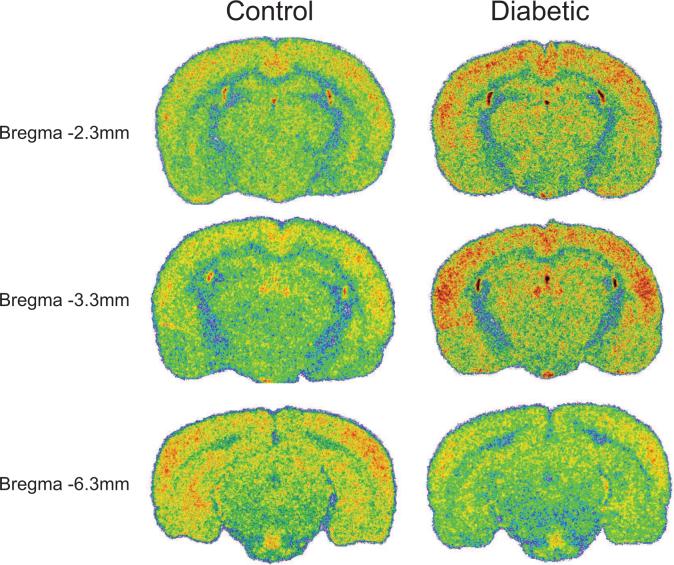
Figure 3.
Sample colorized coronal sections showing differences in resting brain activation between non-diabetic control and STZ-D rats, at three A–P levels: −2.3, −3.3 and −6.3. Note: each image is taken from a single brain section in individual animals and therefore may not accurately depict group means presented in the table and graphs.

