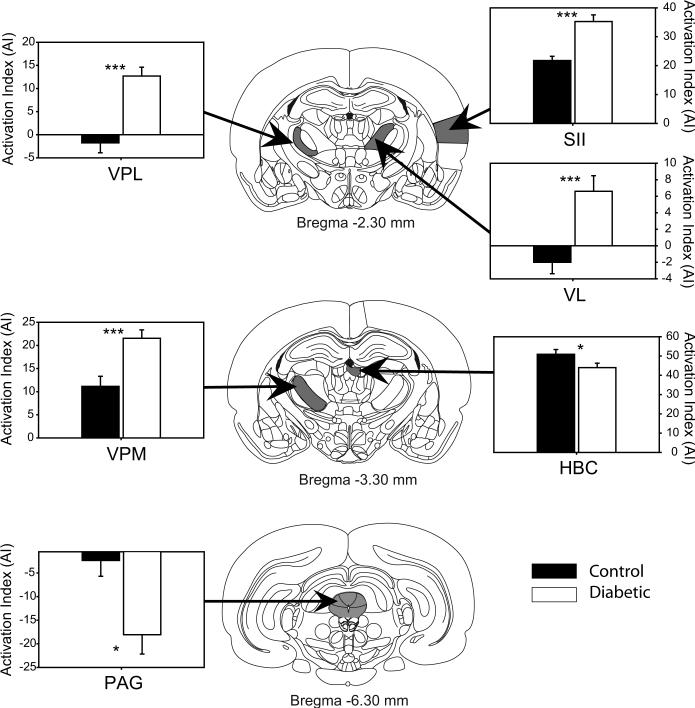
Figure 4.
The bar graphs compare the mean basal (unstimulated) bilateral level of activation (AI) in somatosensory and endogeneous antinociceptive ROIs for control (black circles) and diabetic experimental (open circles) groups six weeks after injection of vehicle or STZ. Data are shown only for ROIs showing a significant difference in activation between the two groups. Significant differences in AI between groups were determined using a mixed-model repeated measures ANOVA corrected for multiple comparisons (SPSS for Windows). Line drawings of sampled brain regions were modified from the stereotaxic atlas of the rat brain (Paxinos and Watson, 1998) to show the approximate Anterior-Posterior (AP) level where each brain region was sampled. Asterisks indicate: * = p < .05; ** = p < .005; *** = p< .0001.

