
Figure 2.
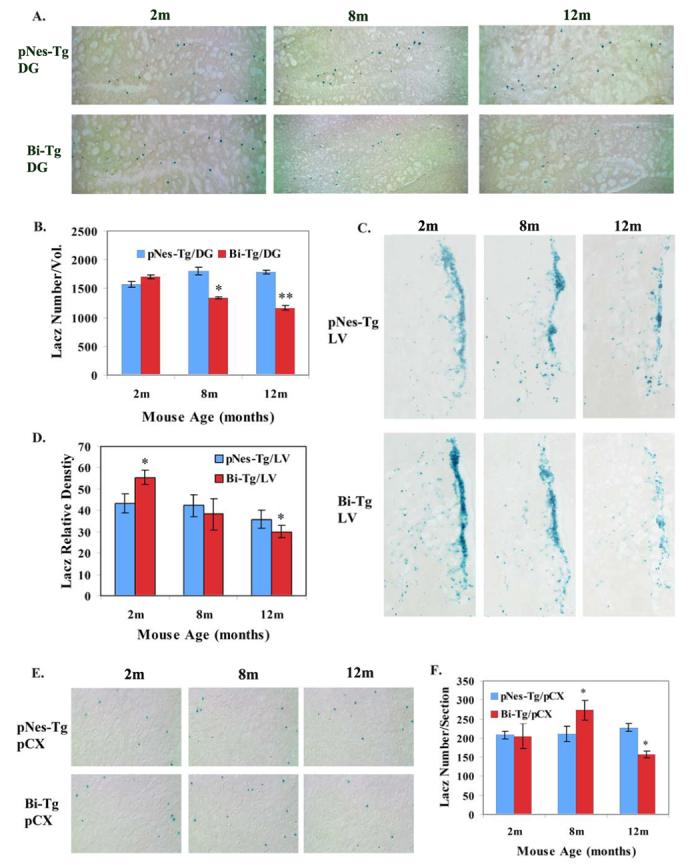
The effects of Aβ plaques on the distribution and organization of NPCs in the brain of AD-like transgenic mice. A. Representative LacZ staining images demonstrating the number of NPCs in the dentate gyrus (DG) of Bi-Tg mice at 2, 8 and 12 months of age (m) compared to that of the age-matched control pNes-Tg mice. B. The total number of NPCs in the DG (−1.70 to −2.66 from Bregma) of the Bi-Tg mice at 2, 8 and 12 months of age compared to that of the age-matched control pNes-Tg mice (* p<0.05; ** p<0.005). C. Representative LacZ staining images demonstrating the distribution of NPCs in the lateral ventricle regions in the Bi-Tg mice at 2, 8 and 12 months of age compared to age-matched normal control (pNes-Tg) mice. D. The relative staining intensity in the lateral ventricle regions of Bi-Tg mice at 2, 8 and 12 months of age (m) compared to age-matched pNes-Tg mice (*p< 0.05). E. Representative LacZ staining images demonstrating the distribution of NPCs in the prefrontal cortex of Bi-Tg mice at 2, 8 and 12 months of age compared to age-matched normal control (pNes-Tg) mice. F. The total number of NPCs in the prefrontal cortex of Bi-Tg mice at 2, 8 and 12 months of age compared to age-matched pNes-Tg mice (*p< 0.05).