Figure 5.
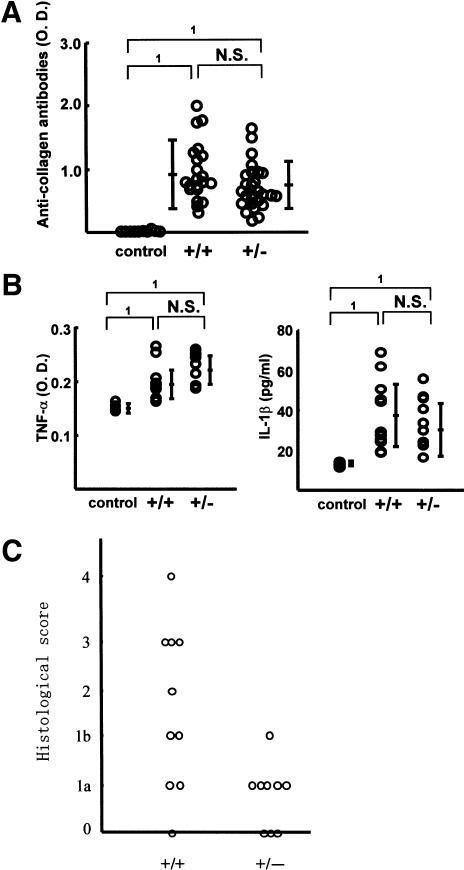
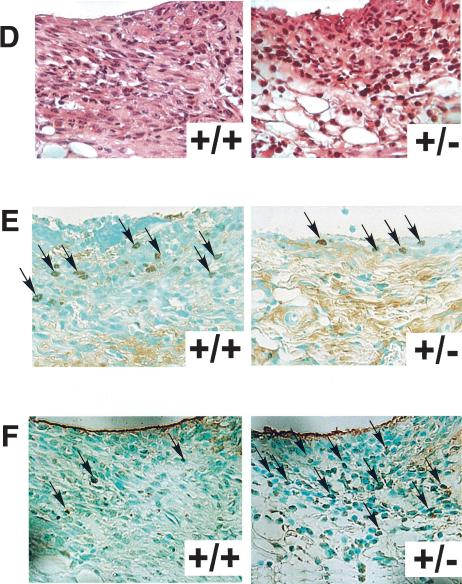
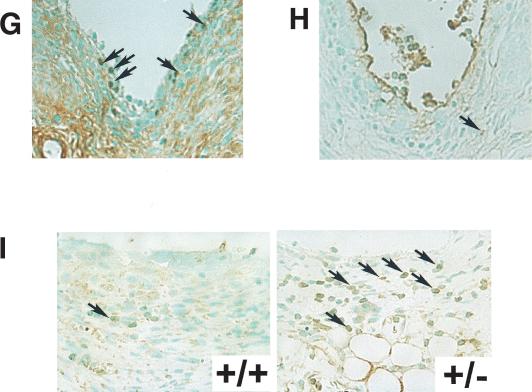
Pathological analysis of collagen-induced arthritis. (A) Serum anti-type II collagen antibody levels in syno+/+ and syno+/- were measured by ELISA on day 21 after the second immunization with type II collagen. Data are expressed as mean ± S.D. (1) p < 0.01; (N.S.) not significant. (B) Serum TNFα (left) and IL-1β (right) levels were measured by ELISA on day 21 after the second immunization. Data are expressed as mean ± S.D. (1) p < 0.01; (N.S.) not significant. (C) Histological arthritis score of collagen-induced arthritis in syno+/+ and syno+/- mice. (D) Sagittal sections of synovia from CIA-syno+/+ and CIA-syno+/- mice, stained with hematoxylin and eosin. (E) PCNA staining (arrows) of the synovium in CIA-syno+/+ and CIA-syno+/- mice. There is no statistical significance between both groups. (F) TUNEL staining (arrows) of the synovium in CIA-syno+/+ and CIA-syno+/- mice. (G) PCNA staining (arrows) of the synovium in Synoviolin/Hrd1-overexpressing mice. (H) TUNEL staining (arrows) of the synovium in Synoviolin/Hrd1-overexpressing mice. (I) ATF6 staining (arrows) of the synovium in syno+/+ and syno+/- mice after CIA. Arrows indicate positive nuclear staining of PCNA, TUNEL, or ATF6. Magnification: D-I, 400×.


