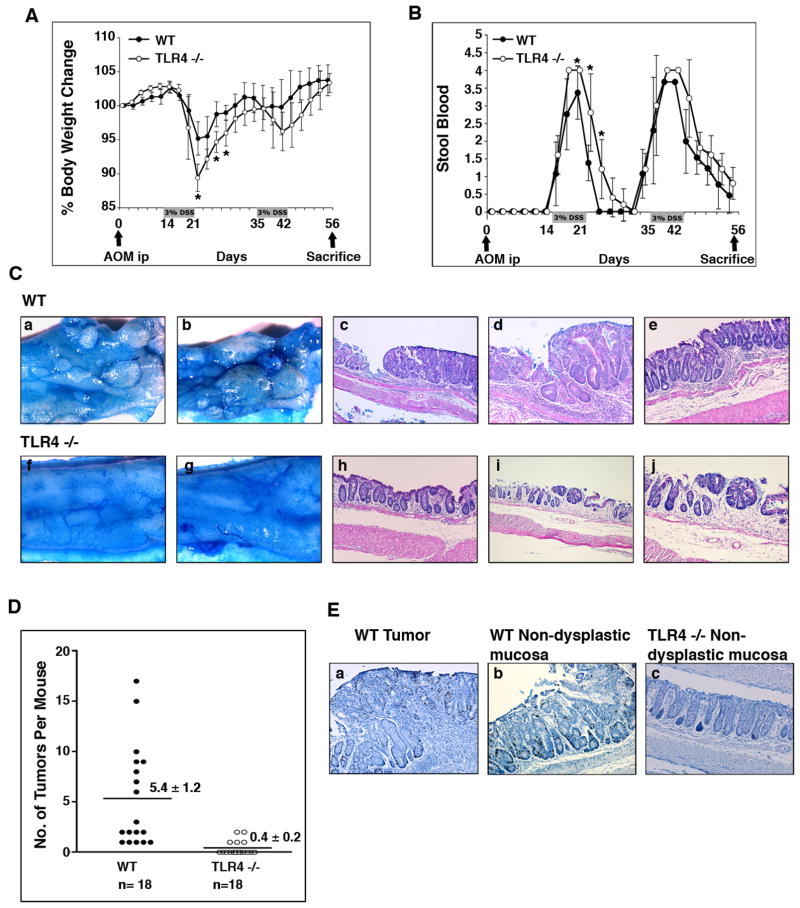
Figure 2. TLR4−/− mice are protected from colonic tumors in the setting of inflammation.
A, B. AOM and DSS were administered as shown. Weight change (A) and stool blood (B) were examined during the study period. The data represent the average (± SD) of four independent experiments with a total of 36 mice (TLR4−/− (n=18), and WT controls (n=18)) (*p<0.05).
C. Tumors in the CAC model. Colons were cut open longitudinally and the mucosal surface was stained with 1% Alcian blue. All WT mice showed multiple polypoid lesions (a, b) but not the TLR4−/− mice (f, g). Microscopically, two examples of WT dysplasias are shown at lower (c) and higher (d) magnifications. Non-dysplastic mucosa from a WT mouse is shown in e. Most TLR4−/− mucosa following AOM-DSS appeared as in panel h. An example of a dysplastic lesion in a TLR4−/− mouse is shown at lower (i) and higher (j) magnifications.
D. Incidence of dysplasia. The number of dysplastic lesions was counted per mouse under the microscope. Data are expressed as mean ± SEM (P < 0.0001).
E. Proliferation in the CAC model. BrDU incorporation was assessed using anti-BrDU Ab staining. Representative pictures are taken from a WT dysplastic lesion (a), and WT non-dysplastic mucosa (b). Mucosa of AOM-DSS treated TLR4−/− mice (c) is also shown.

