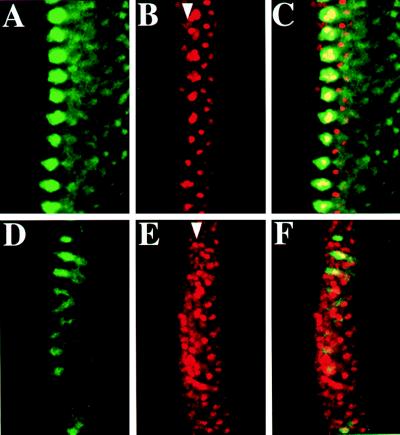
Figure 4.
Nonautonomous Ato repression by MAPK activation. Confocal images of a sca-GAL4;UAS-DER eye disc (A–C) showing increase of dp-ERK (A) and decrease of Ato expression in the stripe and proneural clusters (B). Each cluster of Ato-positive cells in the MF is roughly the size of the stage III clusters (Fig. 1C) in the wild-type disc. However, dp-ERK expression (A) is stronger than in Fig. 1C. (D–F) A sca-GAL4;UAS-DN-DER eye disc of an early third-instar larva. Notice the increase of Ato (E) and decrease of dp-ERK (D) expression. This figure can be compared with the wild-type disc in Fig. 2 D–F. (A–F) Ato is red and dp-ERK is green.

