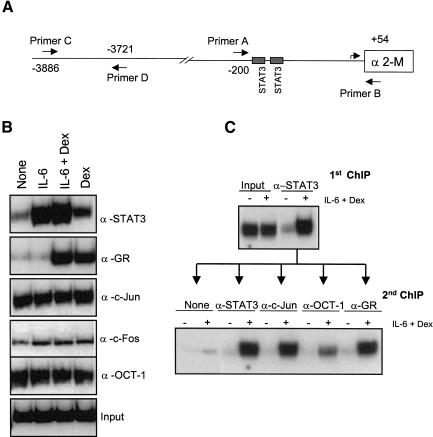
Figure 4.
Recruitment of proteins to the α2-M promoter. (A) Schematic representation of the α2-M promoter -4000 nt to +400 nt from the transcription-starting site. The α2-M box represents the beginning of the coding region, and two gray rectangles represent STAT3-binding sites. The inverted arrow pairs indicate the primers used in the ChIP assays shown below. (B) Soluble chromatin was prepared from H-35 cells treated with IL-6, Dex, or IL-6+Dex for 30 min and immunoprecipitated (IP) with the indicated antibodies. (C) Double immunoprecipitation ChIP assay. Soluble chromatin was prepared from H-35 cells treated or not with IL-6+Dex for 60 min and immunoprecipitated with antibodies against STAT3 (first IP) as in B. The immunoprecipitates were washed, resuspended, disrupted, and immunoprecipitated a second time with antibodies against STAT3, GR, c-Jun, or OCT-1 (second IP). The final DNA extractions were amplified using the primers A and B that cover the regions of the α2-M enhancer. No signal was obtained with primers C and D (data not shown).

