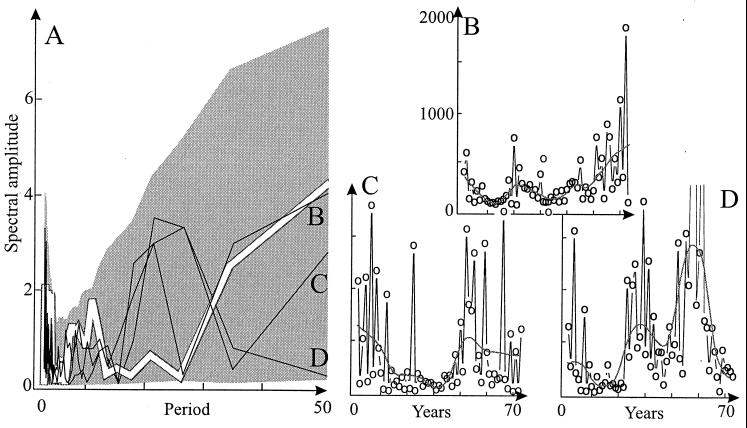
Figure 3.
(A) The spectral density of the 0-group count (for the post-World War II Southern data) is represented by the thick white line. It has significant peaks in the low- and the high-frequency ends of the spectrum (see text). The shaded area represents the 95% envelope for the spectrum of the optimally parameterized age-structured model (Table 1). The envelope is estimated across 1,000 simulations each of 50 years after discarding a transient period of 100 years. The model spectrum has a distinct bimodal shape that embraces the spectrum of the 0-group counts (thick white line). The spectra of three of the 1,000 realizations of the stochastic model are shown as thin black lines (labeled B, C, and D). (B–D) The time trajectories of the three stochastic realizations whose spectra are shown in A. The smooth lines represent running averages to highlight apparent long-term trends (the dynamics are really stationary).

