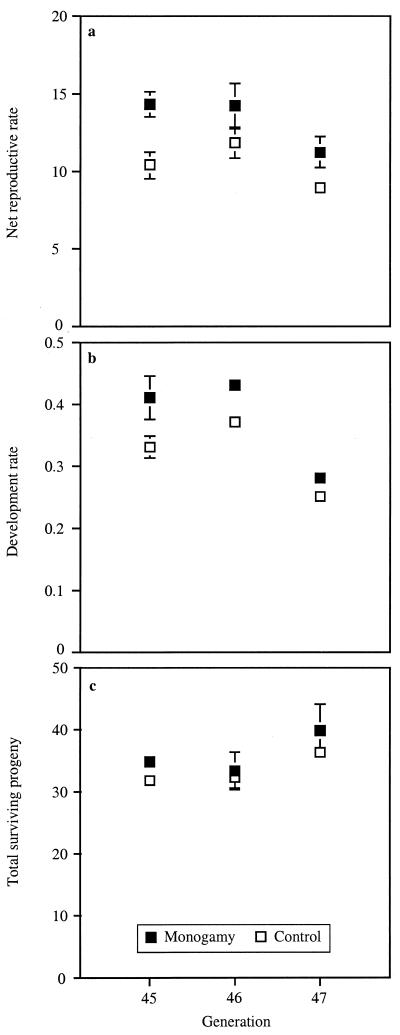
Figure 5.
Measures of population performance under standardized culturing protocol replicated across three generations. (a) The net reproductive rate is the number of mature (eclosed) progeny per female. This rate was counted at the end of each 14-day propagation cycle (monogamy > control; P = 0.02). (b) The development rate is the fraction of the total surviving progeny that had matured by the end of each 14-day propagation cycle (monogamy > control; P = 0.006). (c) Total surviving progeny included the slow-developing progeny that matured after the end of the 14-day cycle (monogamy = control; P = 0.4). Error bars are ±1 SEM (based on the variance between replicate populations; some error bars are not visible). For each graph, three 2-tailed Student’s t tests (n = 4, df = 2) were pooled for each generation via a consensus combined-probability test (45) to obtain an overall P value.

