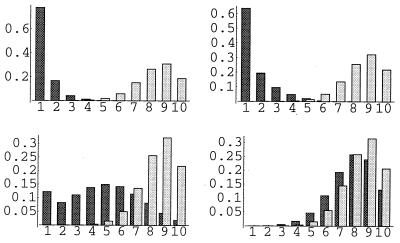
Figure 8.
The effect of transmission bottleneck size on the pathotype distributions for n = 25 and t = 10 in the vertical (shaded bars) and horizontal (open bars) models. (Upper Left) b = 1; (Upper Right) b = 2; (Bottom Left) b = 4; (Bottom Right) b = 8. The simulation procedure is as described in Fig. 6.

