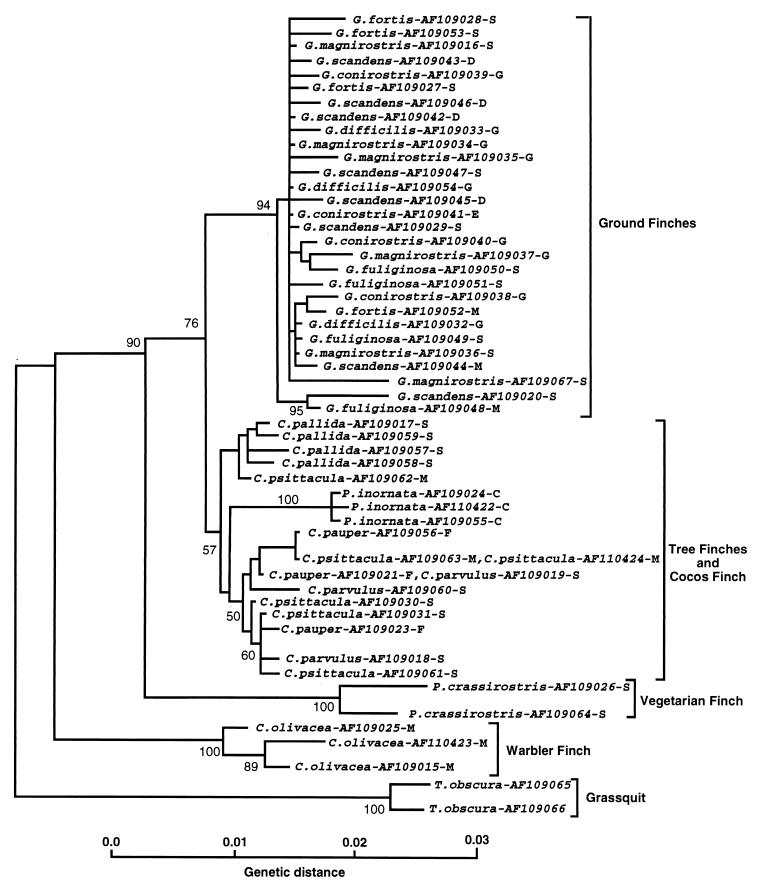
Figure 2.
Phylogenetic tree of Darwin’s finches and the dull-colored grassquit based on 55 cr sequences and drawn by the NJ algorithm of the mega program (16) using Tamura-Nei (11) distances. The numbers on the nodes indicate the percent recovery of these nodes in 500 bootstrap replications. The species names are followed by GenBank accession codes of the sequences and an abbreviation of the island where the blood samples were collected. C, Cocos Island; D, Daphne Major; E, Espanola; F, Floreana; G, Genovesa; M, Marchena; S, Santa Cruz.

