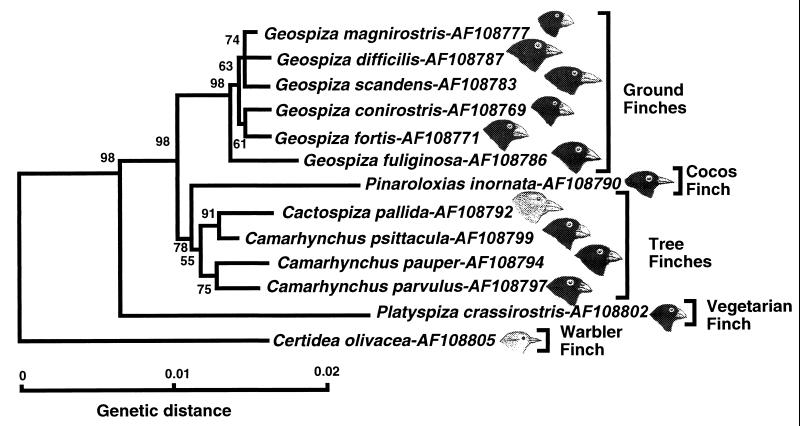
Figure 5.
NJ tree of combined cytb and cr sequences. For simplicity’s sake, a single representative sequence is displayed for each species of Darwin’s finches, and the outgroup has been left out. The drawings point out differences in one of the distinguishing morphological characters of Darwin’s finch species—the shape of the beak. (Bird drawings based in part on ref. 4.)

