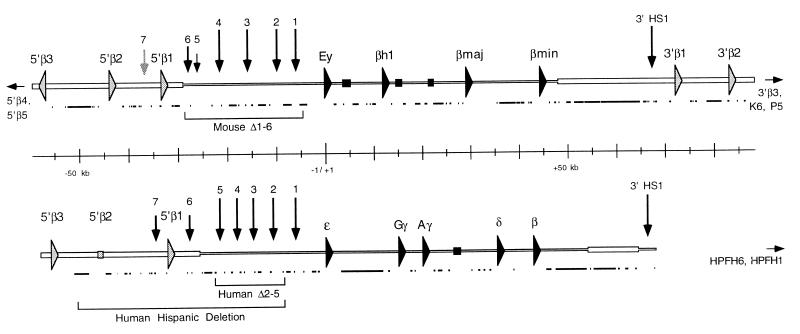
Figure 1.
Mouse (Upper) and human (Lower) β-globin loci. The cap sites of the human ɛ-globin gene and of the mouse Ey gene are set as +1. Sequences reported here are represented by a wider horizontal bar. Globin genes are represented by filled arrows, olfactory receptor ORFs by shaded arrows, and pseudogenes by filled or shaded boxes. HSs are shown as vertical arrows. The lengths of the arrows illustrate the relative intensities of the HS that they represent; the arrow indicating mouse 5′ HS7 is lighter to indicate that this site is still hypothetical. The lower, filled lines for both mouse and human loci designate repetitive elements. Horizontal arrows pointing outward from these sequences indicate the presence of additional olfactory receptor ORFs located beyond the regions shown here. Brackets beneath the sequences show the extent of deletions within the β-globin locus that are discussed in the text.

