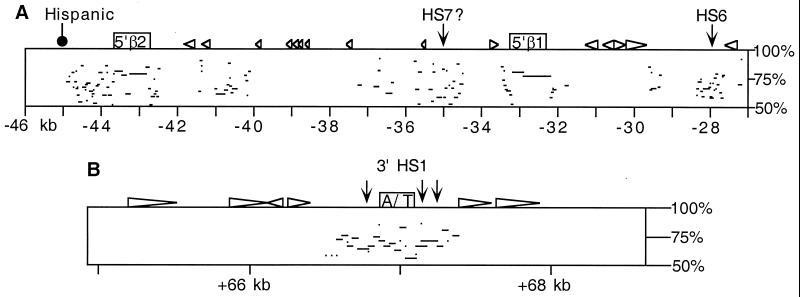
Figure 2.
PIP analyses of mouse and human sequences. (A) PIP of the region 5′ of the β-globin LCR. The mouse sequence is represented at the top, and the percent identity of gap-free aligning segments from human is plotted beneath. The odorant receptor genes MOR5′β1 and MOR5′β2 are indicated as boxes, and repetitive elements shown as triangles. The positions of HSs and the 5′ breakpoint of the human Hispanic deletion are indicated. Distance from the hypothetical Ey cap site in kb is shown on the bottom. For reference, the homologous human sequences that give rise to the alignments shown here correspond to HOR5′β1 and HOR5′β2 and surrounding regions as shown in Fig. 1. (B) PIP of the region of homology 3′ of the β-globin genes. The mouse sequence is represented at the top, with comparison made to the human 3′ HS1 sequence (24). The A/T-rich region is indicated by the shaded box.

