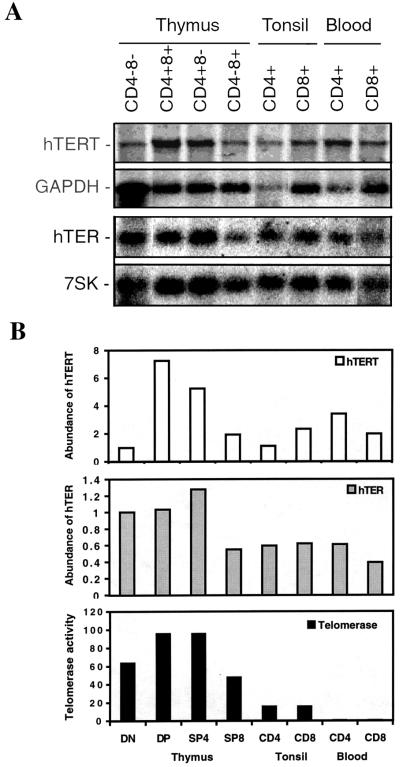
Figure 2.
hTERT mRNA expression and telomerase activity in normal human T cells. (A) Representative Northern blot of hTERT and hTER expression in thymocytes, tonsil T cells, and peripheral-blood T cells is shown. The blots were probed sequentially with either hTERT and GAPDH or hTER and 7SK probes. (B) Comparison of relative abundance of hTERT and hTER expression and telomerase activity. The levels of hTERT and hTER from each cell subset were determined by imagequant software. The relative abundance of hTERT mRNA and hTER were calculated by normalizing on the basis of cell equivalents. The bars represent relative abundance of hTERT (open bars) and hTER (gray bars) transcripts for each cell subset. The level of hTERT and hTER in double-negative (DN) thymocyte was arbitrarily set at 1. Telomerase activity was measured by a modified TRAP assay as described (33). The black bars represent the relative telomerase activity. The level of telomerase enzymatic activity in the CD4−CD8− subset was arbitrarily set at 1. DP, double-positive; SP, single-positive.

