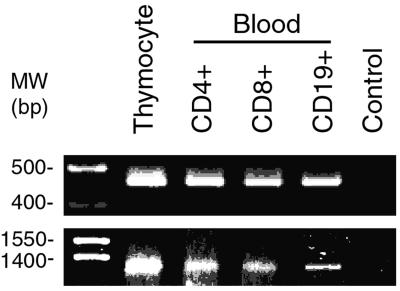
Figure 5.
RT-PCR analysis of hTERT expression in B and T lymphocytes. (Upper) Representative result of the RT-PCR analysis of B and T lymphocyte hTERT expression with primers hTERT-2164S and hTERT-2620A (35). The amplified products were separated on a 2.0% agarose gel and visualized by ethidium bromide staining. The α- and β-deletions of hTERT result in a loss of 36 bp and 182 bp, respectively. (Lower) Representative result of RT-PCR analysis of B and T lymphocyte hTERT expression with primers hTERT-1680S and hTERT-2974A, which cover the entire region of reverse transcriptase. The amplified products were separated on a 1.2% agarose gel and visualized by ethidium bromide staining. The DNA molecular weight markers were run alongside the samples and indicated at the left.

